 Drift
DriftJDAM
JDAM · Air Force · Boeing
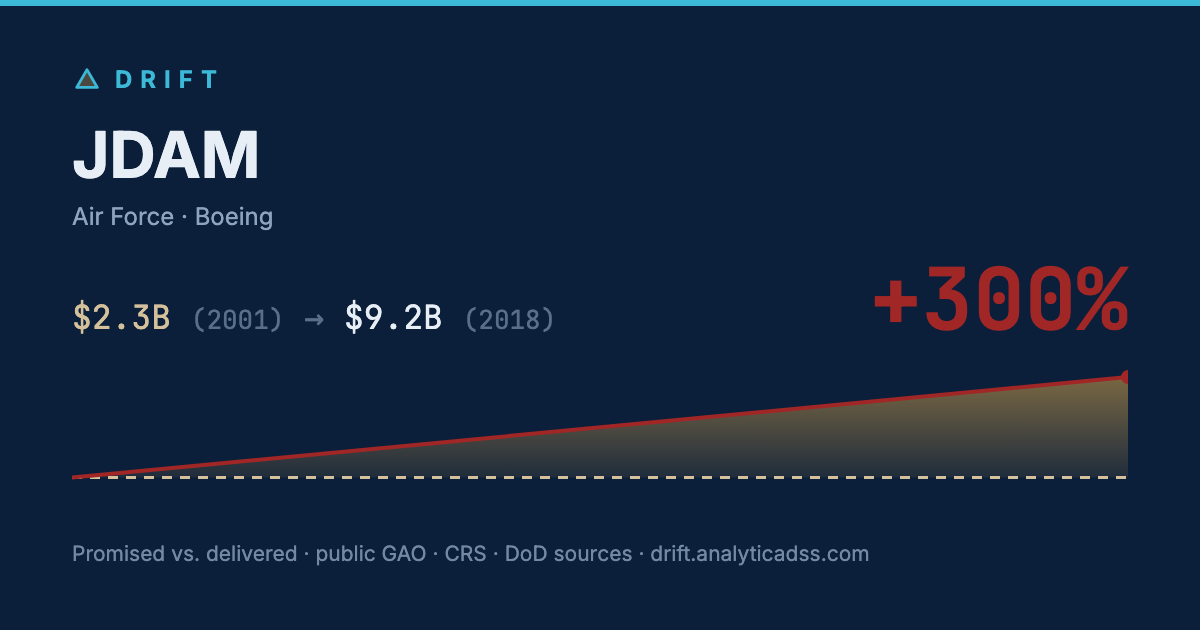
+300%
$2.3B (2001) → $9.2B (2018)
 Explore JDAM interactively →
Download 1-page brief (PDF)
Explore JDAM interactively →
Download 1-page brief (PDF)
Baseline
$2.3B (2001)
Current estimate
$9.2B (2018)
Cost growth
+300%
Units
89065 → 470656
Quantity change
+428%
Unit-cost change
−24%
IOC
2000 (planned, F/A-18) → 2001
Schedule slip
+1 yr
Cost basis
BY
Confidence
high · reconciled
The total quadrupled in constant dollars — and that is the GOOD story: the buy grew from 89,000 tail kits to 471,000 while cost per kit FELL (~$25.8k → ~$19.6k BY1995$); GAO’s quantity-adjusted measure shows an 87% cost reduction since baseline. Cost-growth headlines without quantities would get this one exactly backwards.
Source: JDAM SAR Dec 2018 (19-F-1098 DOC 46), Cost Summary p.18 (BY1995$: Mar 2001 production APB $2,300.3M → current $9,211.5M; TY $2,606.7M → $12,529.4M) + Total Quantity p.19 (89,065 → 470,656 tail kits). Verified against the DoD Dec 2018 comprehensive SAR summary table. GAO-19-336SP Obs. 6 + App. VII Table 22: quantity-adjusted cost REDUCTION of $3.35B (−87%). No Nunn-McCurdy breaches, either baseline.
Drift — an independent project by Aous Abdo · Analytica DSS, built from public GAO, CRS and DoD sources. Cost growth has many causes; a larger number is not by itself evidence of mismanagement. How this is built · Explore the data →